Creating a Google Site is as easy as editing a document. You can integrate with other Google products by inserting videos, docs, spreadsheets, presentations, calendars, charts and other gadgets.
Google offers other services for developers to build their own awesome sites.
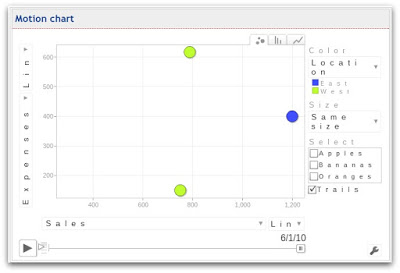
One such service is Visualization Motion Charts. These charts include interactive selections and play button. A great addition to any Google Site.
You can insert these motion charts in Google Sites thanks to a gadget that Google Engineers created.
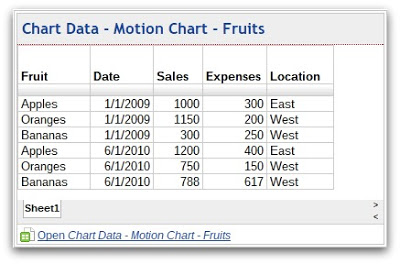
Before inserting the gadget, the chart requires data. Simply create or use an existing Google Spreadsheet like this one.
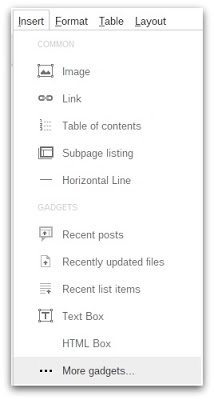
Create or open an existing Google Site web page. Edit the page (click the edit icon) and click on “Insert” and “More gadgets”.
Click on “Public” and search for “motion chart”.
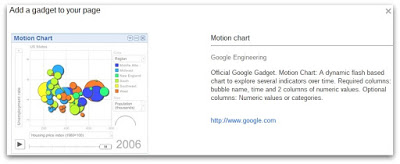
Click on the “Motion chart” search result. You will see this confirmation.
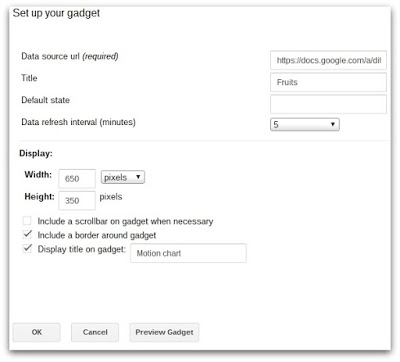
Click the “Select” button. Next, update the gadget parameters with your spreadsheet URL, chart title, interval refresh minutes, enter a width of “650 pixels” with a height of “400 pixels” and click “Save”. To learn more about the optional “Default state” click here.
Give it a try and let us know how much you like Motion Charts in your Google Sites in the comments section below! Also, if you found this blog post informative, give it a +1 so others can receive the same benefits.
