Last week, Brian Burchanowski provided us with an awesome and informative blog post on ‘Creating Forms in Google Docs.’ This week, we will discuss what to do with the data that is gathered from the people that filled out the survey/form.
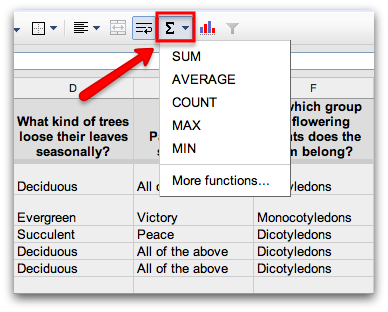
Now that you have sent the form out, the data collected will be posted in a Google Spreadsheet where you can review the responses and take further actions. If one or more of your questions delivered a numerical answer that you were looking to find an average amount, the total count, or a sum of the data, you can use the basic functions provided in the spreadsheet options. Simply highlight the numbers you wish to perform this action on and select the required function.
Another way to view the data collected and break it down is in the form of graphs. From within the spreadsheet that contains the data, click on ‘Form’ and then select ‘Show summary of responses.’ This view will show you a different graphical representation for each question asked and the responses from the audience. This can be very helpful when needing to present your data to a group of people so it is easy to understand and break down.

How will you utilize the above features when managing your data? Let us know if the comment section below!
Recent Posts
Webinar Replays